Tuning uWSGI, or: Why So Slow?
Linode’s public API has seen steady growth in traffic as we cut away from legacy management options over to new ones that leverage the API. Earlier this year, we made a change that improved performance immensely. I detail the change, and how it was discovered, below.
As traffic increased, we began to occasionally hit a critical threshold where service degradation occurred. The primary symptom was higher response times. The service had hit the same limit before, and the approach taken then was simply to scale horizontally (add more boxes.) This became our plan to address the new limit.
Luckily, our team’s manager at the time had a lot of experience with scaling services, and dropped some hints that ultimately led to a much better solution being found (thanks Ben!).
The API is a Flask app that interacts with a database and several other networked services. It’s run under uWSGI on six four-core Linodes, the VPSs of our namesake. At the time, uWSGI was configured to run four worker processes, each with eight threads, for a total count of 192 threads across 24 processes.
Theoretically, 192 threads should mean that 192 requests can be served concurrently. Little’s law states that the mean number of requests being served concurrently is identical to the mean response time multiplied by the mean throughput. We were starting to see accelerated performance degradation around 10k rpm. Degradation would result in average response times in the 500ms range, which according to Little’s law meant that on average we were serving 83 requests concurrently. Clearly 83 is much lower than our theoretical cap of 192. Of course, running the system at the threshold of capacity is not desirable either, but one would expect that performance wouldn’t degrade so drastically until there was less headroom left to work with. What was going on?
After some initial poking around, I ended up checking the uWSGI stats server output on a production box with uwsgitop, which is essentially a top-like frontend around the stats server. The thing that caught my eye was the “%” column, which shows the relative number of requests served per worker (processes). You’ll see that the distribution is quite uneven, with one process having served around 43% percent of requests since the server was inited.
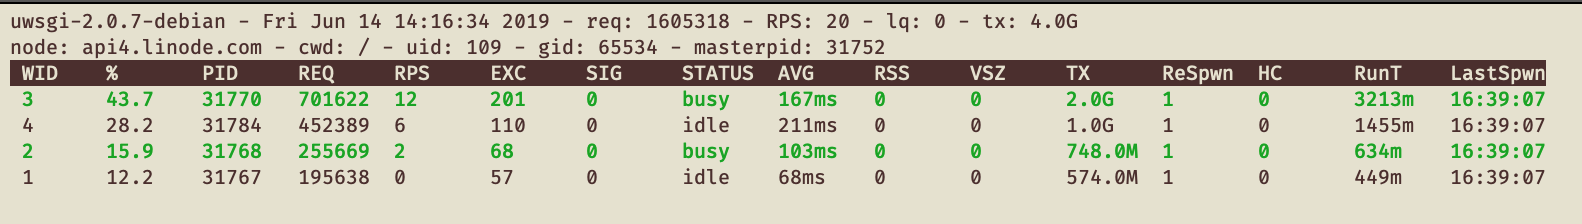
Unfortunately, I don’t have a solid answer as to why this was happening, though I have a theory, which is that the the process with the most utilization had some cpu affinity to the least loaded (virtualized) cpu core. The threads belonging to this process would be the most responsive to an incoming request on the socket, and thus would be first to claim the new request. This would result in these threads claiming the most requests, but then spending lots of time thrashing for the GIL, since they were all running under one python interpreter. I don’t have a great understand of how the kernel handles multiple threads/processes blocking on a socket, but this post makes me think it’s probably something like this.
Regardless of the why, it quickly became clear to me that fixing this utilization issue would likely go a long way to improving performance. I decided to try the simplest thing: going from eight threads per process to one. This is actually what the (endearing yet sparse) uWSGI docs suggest. I also decided that for my first go, I would try doubling the number of processes from four to eight. We weren’t running very high CPU numbers, and memory pressure wasn’t too bad, so this seemed like it would be a safe bet. Looking back I wish I’d gone with a four worker/one thread config for the first run, in order to get a more controlled comparison. At the time I was more worried about making things work better, not the subsequent analysis. Lesson learned I guess. One thing at a time.
One Thursday before lunch, I changed the config on one of our API boxes and restarted the server. The results were, frankly, unbelievable.
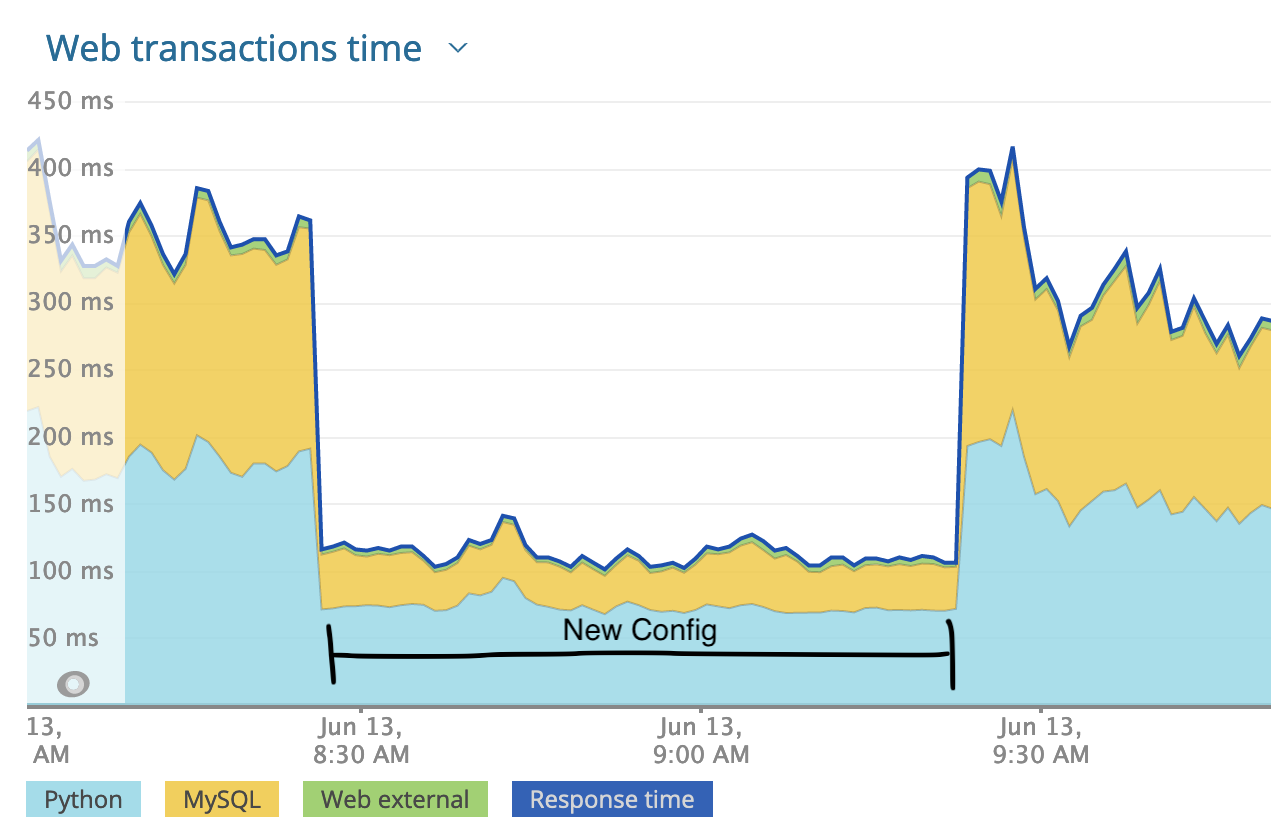
At first I wondered if I had inadvertently broken something, but everything else looked normal. As you can see in the image above, I backed the change out after about 45 min of monitoring. After showing my results around, we decided we’d put the new config on one box over the weekend and observe.
An interesting thing to note about the above response time graph is how the reported database wait time went way down. I can all but guarantee that the database wasn’t actually processing our queries faster. NewRelic (which we use for APM) tracks DBAPI calls to calculate db time, so I can only assume that the underlying problem was causing execution speed in the DBAPI code to drop dramatically as well, though seemingly proportionally moreso than the app code. I can’t explain it, but it’s a good reminder to not blindly trust your reporting tools.
Once the box had been running for a while, I was able to get some useful stats out of uWSGI:
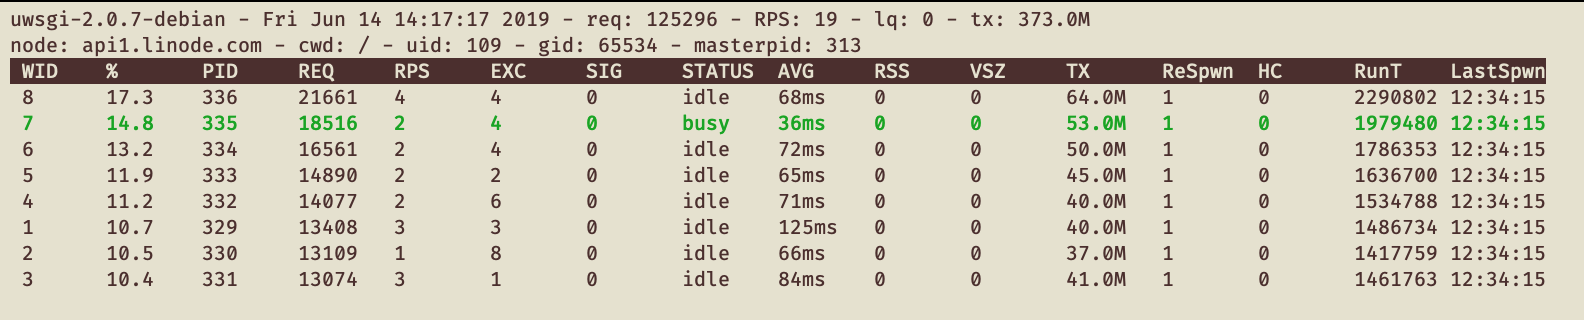
As you can see, the utilization is still a bit uneven, with worker utilization ranging from 10-17%. Unfortunately I can’t explain this; it could have to do with cpu affinity, or perhaps with something within uWSGI itself. Still, this is a vast improvement on the prior utilization. This change has bought us much more headroom and more consistent performance as we continue to scale up the API.
To summarize, tuning app performance requires a few things:
- Recognizing that a problem exists. If it hadn’t been for our manager making a casual comment about Little’s law and theoretical throughput, I wouldn’t have been tipped off to the fact that some basic numbers did not add up.
- Having some understanding of the underlying stack that your app is running on.
- Having monitoring tools and a culture of using them in-place.